

As cities grapple with rapid urbanization and chronic traffic congestion, Transit-Oriented Development (TOD) has emerged as a transformative solution delivering shared benefits for government, private investors, and communities. This model fosters vibrant urban districts with high-density development within a 5-10 minute walk of major public transit hubs—railway stations, metro terminals, or Bus Rapid Transit (BRT) facilities that serve as the backbone of daily mobility. TOD’s core mission is clear: reduce automobile dependency, catalyze sustainable growth, ensure equitable access to opportunities, and forge dynamic, resilient urban centers.
Successful TOD examples demonstrate their transformative power: Tokyo’s Marunouchi district around the central station, San Francisco’s Salesforce Transit Hub area, and London’s revitalized King’s Cross quarter. These developments succeed because they generate compelling benefits across multiple stakeholders. For governments, TOD delivers fiscal efficiency through reduced road infrastructure costs, enhanced public transit system performance, and robust revenue streams from land value capture mechanisms like Tax Increment Financing. Private investors benefit from substantial real estate appreciation—retail values can increase by up to 167%, office values 120%, and residential rents 45% compared to transit-isolated locations. Communities benefit from significant time savings—the Salesforce Transit Center alone generates $380 million annually in travel time benefits, in Singapore, seven of ten households now live within a 10-minute walk of transit stations —while expanding equitable access to employment and services.

Figure 1: San Francisco’s Salesforce Transit Center exemplifies best-practice TOD through seamless integration of 11 transit lines, exceptional pedestrian connectivity, innovative rooftop park creating downtown’s largest green space, and measurable real estate value uplift. Source: Salesforce Transit Center and Pelli Clarke Pelli
6 Pillars of Successful TOD
What makes a TOD project successful? Professor Robert Cervero, a leading scholar in urban planning and transportation, identifies six critical success characteristics (the “6Ds”):
- Density: Concentrating population, employment, and activities around transit nodes to boost ridership and shorten travel distances. Indicator: Floor Area Ratio (FAR) or population/employment density per hectare.
- Diversity: Mixing residential, office, retail, and civic uses to sustain daily activity and cut down on trips. Indicator: Minimum 40% non-residential floor area within walking distance of major transfer stations.
- Design: Creating pedestrian and cyclist-friendly environments that prioritize human-scale experiences over automobile accommodation. Standard: Minimum 4-meter sidewalk widths with 70% tree or canopy coverage.
- Destination Accessibility: Ensuring stations efficiently connect riders to major employment centers, educational institutions, and essential services. Target: Maximum 30-minute multimodal transit time to centers with 50,000+ jobs within an 800m radius.
- Distance to Transit: Positioning key destinations within optimal walking distances to maximize convenience and ridership. Standard: Maximum 800-meter actual walking distance from all key buildings to stations.
- Demand Management: Implementing policies that discourage private vehicle use through parking limitations, congestion pricing, and transit incentives. Target: 50% reduction in standard parking requirements.
Strategic Positioning Through 3 Core Values
Each station requires a tailored approach based on its unique context and role within the broader transit network. Success hinges on accurately assessing a station’s strategic position through three complementary value dimensions:

Figure 2: The World Bank’s integrated three-value framework for TOD positioning. Source: Author
- Node Value: A station’s centrality within the regional transit network, measured by line convergence, service frequency, passenger volumes, and network connectivity. High node value demands sophisticated transfer infrastructure, including multiple exits, bus terminals, and bicycle facilities. Tokyo Station exemplifies maximum node value as Japan’s premier rail hub, integrating high-speed rail, regional services, and urban metro systems. In Ho Chi Minh City, Suoi Tien Station achieves significant node value by connecting the Eastern Bus Terminal with metro extensions to Binh Duong and Dong Nai.
- Catchment Value: Development potential within an ~800m walking radius, including population, jobs, income, and available/redevelopable land. This shapes density and functional mix. Ho Chi Minh City’s Metro Line 1 underground stations in the urban core demonstrate high catchment value through their proximity to established activity centers.
- Place Value: The quality of public realm, amenities, and cultural identity that transforms transit stations into compelling destinations. Singapore’s Orchard Station leverages its position at the gateway to the renowned Orchard Road shopping district, while Ho Chi Minh City’s Opera House Station capitalizes on pedestrian-friendly streetscapes, heritage architecture, and premium retail environments.
Node and catchment values are typically the most decisive in determining development potential, while place value, though influential, can be enhanced through strategic public realm investments and private development initiatives. These three dimensions collectively define a hierarchy of station types:
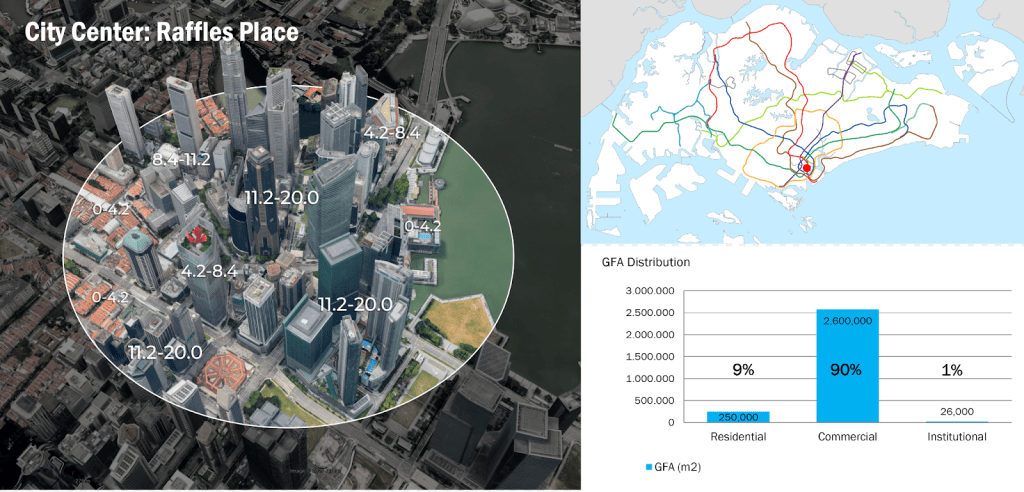
Figure 3: Singapore’s Raffles Place TOD zone demonstrates optimal floor area allocation across residential, commercial/office, and institutional uses. Source: Author
- City Centers: Stations with exceptional node, catchment, and place values, typically located in established central business districts. These transit super-hubs accommodate two to three intersecting lines and might include intercity rail connections. Floor area allocation heavily favors commercial uses (80-90%), with limited residential and civic components. Raffles Place Station epitomizes this typology as the intersection of Singapore’s foundational East-West and North-South MRT lines, serving the financial district core where commercial uses dominate 90% of proximate floor area. Ho Chi Minh City’s Ben Thanh and Thu Thiem stations represent emerging examples of this typology.
 Figure 4: Singapore’s Tampines TOD zone demonstrates optimal floor area allocation across residential, commercial/office, and institutional uses. Source: Author
- Regional Centers: Where two lines intersect, usually the center of a region, supporting more balanced mixed-use development with 50-60% residential, 30% commercial, and 10-20% civic uses. Singapore’s Tampines Station illustrates this model as a dual-line intersection anchoring eastern Singapore’s major employment cluster. Ho Chi Minh City’s future Truong Tho Station, planned as the Metro Lines 1 and 7 junction, will become an important TOD zone when the surrounding urban development and Line 7 construction materialize, fundamentally transforming the area’s three-value profile.

Figure 5: Singapore’s Sengkang TOD zone demonstrates optimal floor area allocation across residential, commercial/office, and institutional uses. Source: Author
- Town Centers: Single-line facilities prioritizing residential development (80-90%) with supporting neighborhood retail (10-20%). Singapore’s Sengkang Station exemplifies this residential-focused typology within a master-planned new town. These stations, which constitute the majority in most networks, serve as daily journey origins and naturally concentrate housing development.
5 Strategic Investment Models
TOD’s economic impact is well-documented across the US and Asia. In the US, San Diego’s light rail stations saw retail values rise 167%, Santa Clara’s VTA offices 120%, and rentals 45% versus non-transit zones. San Francisco’s $4.2 billion Transbay Center generated $87 billion in GRP and $3.9 billion in property value within 1.2km, saving $380 million yearly in travel costs. Asian markets show comparable results: Singapore MRT-adjacent apartments appreciated 10-15% from 2009-2020, with the new Thomson-East Coast line recording 6.8% price premiums in its opening quarters, 20% commercial rent increases, and 15-20% office rent premiums for Grade A buildings near five MRT lines. Hong Kong’s MTR “Rail + Property” model has driven 14-22% retail value increases and up to 25% office rent premiums in the Central district. Major Chinese cities, including Shenzhen, Shanghai, Hangzhou, and Guangzhou, report 6-10% residential price increases and 10-18% commercial value uplift around new stations.
These value gains enable governments and investors to capture land appreciation through financing transit infrastructure and TOD development, reducing public fiscal burden while sustaining virtuous growth cycles.

Figure 6: TOD generates maximum value uplift for retail properties, followed by office developments, driven by expanded customer accessibility. Source: Author
5 proven models enable value capture to finance TOD implementation:
- Tax Increment Financing (TIF): Municipalities establish dedicated development funds by capturing a portion of property tax increases above baseline values. Incremental revenues are collected over 10-25-year periods to amortize public infrastructure investments. Jakarta’s TOD District demonstrates this approach by setting baseline values using Land & Building Tax (PBB-P2) and transfer duty (BPHTB) rates from district approval. Subsequently, 100% of PBB-P2 increases and 50% of BPHTB revenues within 800-meter station catchments flow into the TOD TIF fund, financing pedestrian infrastructure, streetscape improvements, land acquisition, and affordable housing (20% allocation). The fund operates for a maximum of 25 years or until the bond retirement.
- Special Assessment Districts (SAD): Governments levy targeted assessments on properties directly benefiting from new infrastructure investments. Collections are earmarked for specific infrastructure or service packages, expiring upon project cost recovery. Hong Kong’s West Rail project exemplifies this mechanism through HK$630/m² GFA assessments on all new land auctions in Tuen Mun-Tin Shui Wai, contributing to railway cost recovery funds.
- Betterment Levies: Governments collect one-time fees when developers utilize increased development rights enabled by TOD designation, contrasting with TIF’s multi-year tax capture approach. Singapore requires landowners to pay 50% of value increments (calculated as the difference between pre- and post-approval land values for increased Floor Area Ratios) to the state, with proceeds supporting urban infrastructure investment programs.
- Public-Private Partnerships (PPP): Governments grant land development rights to transit operators, who finance rail construction through integrated real estate development and operational profits. Hong Kong’s MTR Corporation epitomizes this model as a transit operator and major property developer, leveraging station-area development rights to finance system expansion while generating shareholder returns.
- Green Bond Financing: Project developers or governments issue certified green bonds, committing proceeds exclusively to environmentally beneficial projects meeting international standards (ICMA Green Bond Principles, Climate Bonds Certification) to access sustainability-focused capital at preferential rates. Shenzhen’s $2 billion green bond program (2020-2023) financed TOD stations and green infrastructure corridors with Climate Bonds certification, supported by fare revenues and commercial station development.
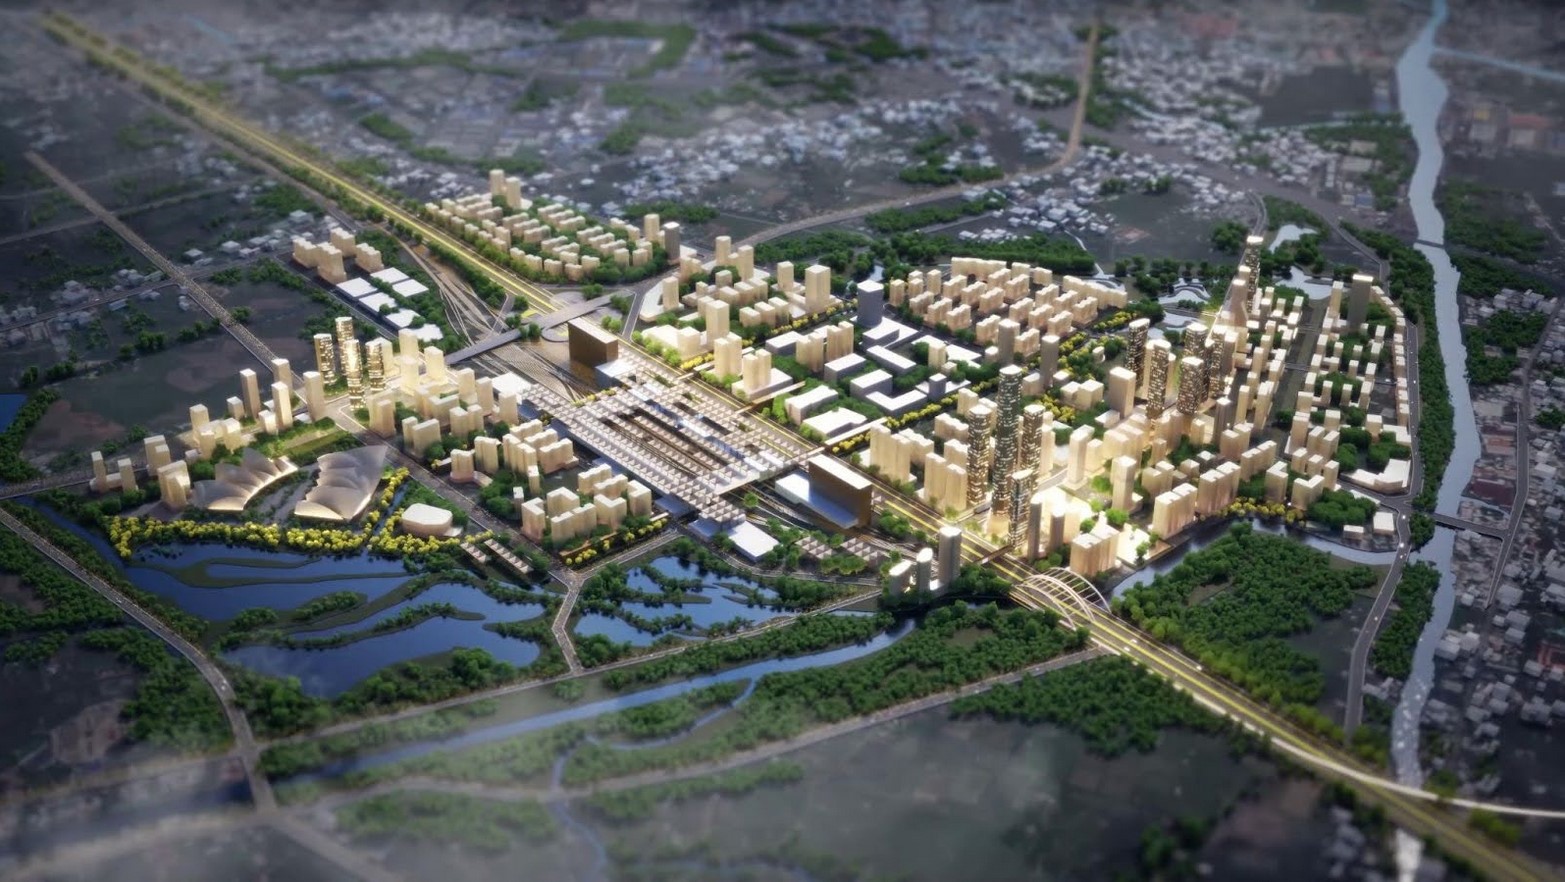 Figure 7: Conceptual development around Tan Kien Station, a terminal for Ho Chi Minh City-Can Tho rail service. Source: enCity
Achieving TOD’s full societal “compound returns” requires aligning five essential conditions: expanding multi-line networks to maximize service coverage; implementing high-density, mixed-use development to sustain all-day activity; investing in compelling destination amenities from retail centers to rooftop parks that extend dwell times; designing pedestrian and cyclist-friendly station environments that enhance place value; and deploying transparent land value capture mechanisms including competitive land auctions, tax increment financing, and public-private partnerships to reinvest in infrastructure expansion.
Strategic coordination among government, private investors, and communities proves essential. Governments must accurately assess node and catchment values, establish clear development parameters, implement value capture mechanisms, and structure public-private partnerships to optimize public investment efficiency. Private investors should strategically acquire land around high-value stations, maximize development rights applications, prioritize commercial and office development, and engage in risk-sharing partnerships. Communities and transit users must actively participate in design processes and amenity planning to ensure TOD delivers practical functionality and enhanced quality of life.
When the six development characteristics, three positioning values, and five investment models operate in harmony, Transit-Oriented Development becomes the economic and social catalyst for urban transformation, generating sustainable compound returns for government, investors, and communities alike.
Dzung Do Nguyen
enCity CEO

 VI
VI